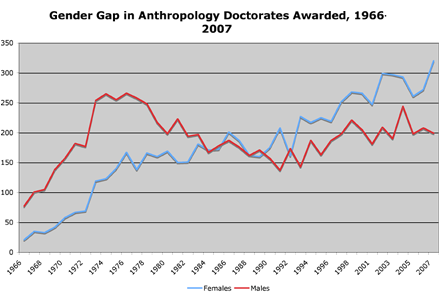
I want here to present some quick graphs that suggest the changing gender dynamics within American anthropology. This first graph shows the production of new doctorates since the 60s. It is commonly thought in the field that there has been something of a “feminization” of anthropology over the past few decades, and as we can see here, the number of doctorates awarded to women (in blue) has indeed been greater than the number of doctorates awarded to men (red) since 1992. We can see here that males were demographically dominant in the production of doctorates until 1984, after which there were eight years of approximate equality (where the two lines overlap) followed by divergence.
Important to note, it seems to me, is that although it’s true that the relative place of males and females has indeed been inverted, the overall picture here is that the two lines have risen together fairly regularly. Quite often, especially in the last fifteen years, we can see that little shifts correlate across genders, as in the little drops in 2001 and 2005. And the demographic expansion of the field in general is of a far greater demographic magnitude than the shift in gender balance. In 2007, we awarded more than five times the number of new doctorates as in 1966 (519 vs. 98) — a fact whose significance I will come back to later. But to get a better sense of changing gender ratios, consider a graph of women as a percentage of the total pool of doctoral recipients.
Continue reading “Gender imbalance in anthropology”